
Although professional sports have never been more valuable or more popular than they are today, successfully managing a league is harder than ever. Central to this challenge is the controversial ideal of competitive equilibrium. While a well-balanced league is often argued to be in everyone’s interests, the economics can disagree. Players resent artificial caps on their salaries, while owners want the freedom to build the team they desire, at the prices they deem appropriate. And ensuring the biggest cities have the most competitive teams can enhance a league’s total revenues and maximize its fan base.
For most of the 20th century, this wasn’t really an issue, as sports didn’t provide the financial incentives for owners to horde talent. But as revenues began to swell throughout the 1980s and 1990s, leagues faced a foundational problem: the vast majority of those revenues – and profits – were accruing to major-market teams.
Though no one expects the profits of a Utah-based team to compete with those of a New York City competitor, growth in “franchise inequality” threatened to lock teams in unending feedback loops. As major-market team revenues increased, so too did their willingness and ability to outspend smaller-market competitors, which led to more wins, more income and even more high-priced players. Tier 2 and Tier 3 market teams, meanwhile, struggled to afford a competitive team and, as a result, saw declining profitability and ever-worse on-court performance.
In a more conventional industry, these competitive dynamics would be OK – inevitable, even. But most sports leagues operate not as a competitive marketplace, but as a democratic club governed by individual team owners. Furthermore, the major-market teams need viable competition to drive higher TV contracts, attendance levels and concession sales. And too much salary-based competition can transfer much of a league’s profits to its players. No owner likes that.
Thus, in 1984, the NBA introduced North America’s first major league salary cap. For the 1984-85 season, team payrolls were limited to the greater of either a fixed sum of $3.6 million ($8.2M in 2015 dollars) or 53% of total NBA gross revenues divided by the number of teams in the league (23 at the time). Crucially, however, this cap included a number of exceptions that allowed teams to exceed the cap to retain players already on their roster. It was, proponents argued, in no one’s interest to force a previously undervalued player to abandon fans that loved him and a team that was willing to pay him more.
Despite good intentions, the salary cap quickly proved ineffective – and over the next 30 years, it has endured non-stop revisions that ultimately left it more complex and unpredictable than those it inspired worldwide. As the NBA hurdles toward a December deadline for the players’ association or owners to terminate their 2011 Collective Bargaining Agreement, you can bet all eyes will be on further tweaks to this payroll system. But the answer is not further change, but an end to this hybridized model altogether.
1984 TO 2002: THE SOFT CAP
Across its first six seasons, the NBA’s salary cap showed tremendous promise. Compliance rose from nearly half of the league’s 23 teams to all but one. At the same time, the offenders reduced their average overage from 30% above the salary cap to less than 10%.
But by the 1992-93 season, the cap’s ability to discourage spending appeared to evaporate. Over the following decade, only 39 of 284 total rosters (14%) came in under the cap, with each of the last four seasons counting 27 offenders and only two compliers. And the degree to which the salary cap was surpassed continued to rise – from only 19% to a record 50% in the 2000-01 season.
Although nearly every team exceeded the soft cap, the correlation between spend and performance demonstrated that the competitive consequences were far from equal:
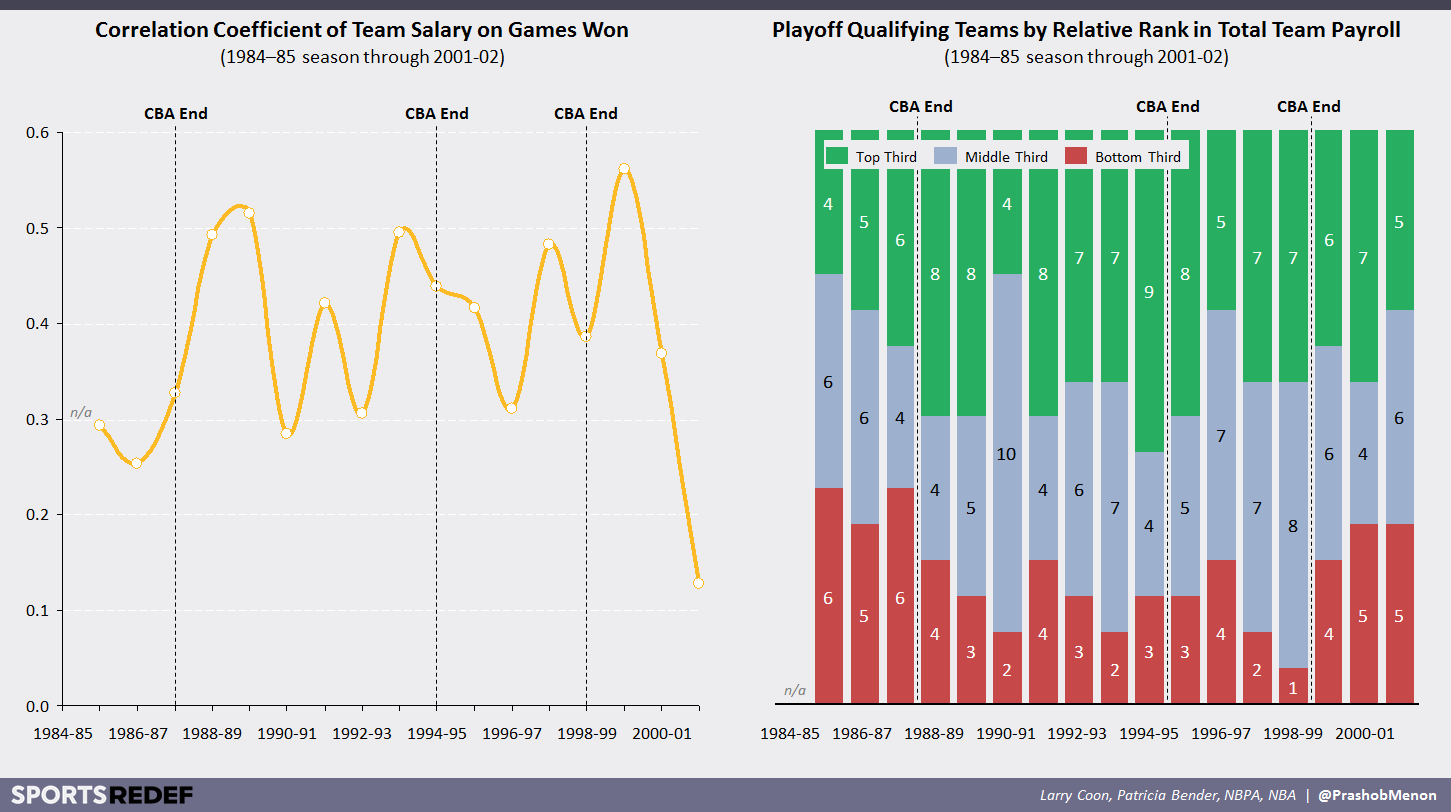
Of course, spend alone doesn’t guarantee success on the court – the specific players and collective roster matter more than dollars spent – but for the first time in the NBA’s history, teams were consistently paying their way to the top. These same roster dynamics led to player salaries growing from 48% of total Basketball-Related Income (BRI) in the early 1980s to 57% during the 1997-98 season. This shift was so great that it enabled team owners to terminate the 1995 NBA Collective Bargaining Agreement only two and half years into its six-year contract. Clearly, they argued, the cap model had to change.
2003 TO 2015: THE SOFT CAP + LUXURY TAX
After a lengthy lockout that cost the NBA half of the 1998-99 season, the league and National Basketball Players’ Association (NBPA) agreed on several changes to the salary system. These included an annual minimum team salary; a complex compensation system where total player payrolls (and the salary cap) were defined by a minimum and maximum share of total BRI; and a luxury tax (LT) that would fine teams $1 for every $1 in payroll expenses that exceeded a newly created tax threshold (initially 131% of the salary cap). While this system, which took effect during the 2002-03 season[1], did not prevent escalating payrolls or competitive imbalance, it did accomplish three goals:
- Make exceeding the soft cap far more expensive for the average team (just under half of all rosters in the last non-LT season would have exceeded the tax threshold)
- Bring the league closer to what many owners wanted: a so-called “hard cap”
- Redirect a meaningful portion of payroll spend back to the league, where it would be used to cover league overhead or be re-distributed to non-taxed and typically less profitable teams. In theory, how much an owner would be willing to spend on a player or team wouldn’t change – just where it went
The subsequent 2005 CBA made incremental changes to this system, including increasing the players’ share of BRI, introducing new salary cap exceptions, and lowering the luxury tax threshold (to roughly 122% of the soft cap). In general, this agreement was viewed as favorable to players, but their victory was bittersweet. As a result of increased salary costs and revenue pressures stemming from the Great Recession, the NBA subsequently experienced several years of widespread losses (the league claimed that 22 of its 30 teams were unprofitable during the 2009-10 season alone). Accordingly, team owners entered the 2011 CBA negotiations demanding not just a 23% reduction in the salary cap, but a shift from a soft to hard one. And thus the NBA entered its second lockout in less than 15 years.
After a 161-day strike that cost the league 16 of 82 regular season games, the owners and NBPA inked a new agreement that left the soft cap + luxury tax model in place, but fundamentally overhauled the latter’s calculation. Under the new system, which came into effect during the 2013-14 season, offending teams would incur a progressive tax rate. Instead of dollar-for-dollar, the first $5M above the luxury tax threshold cost $1.50 per $1 in overage, the second $5M cost $1.75, the third cost $2.50, then $3.25, after which every additional $5M added another $0.50 per dollar to the fine rate. The following year, teams that had incurred the tax in each of the past three seasons would also incur a “repeater tax” that added another $1 per $1 spent. And beginning in 2015-16, repeater qualification tightened to three out of the past four seasons.
The 2011 CBA left the league in a strange position. More than 20 years after it introduced its ground-breaking soft cap, the NBA found itself encumbered with a complex, routinely ignored, exception-filled system. Meanwhile, other major American leagues had introduced significantly simpler payroll models. In 1995 and 2004 the NFL and NHL rolled out hard caps that firmly limited payrolls. MLB introduced its own luxury tax in 1996, without a soft cap beneath it. Given these other approaches, it’s critical to examine whether the soft cap + luxury tax model actually works.
Fighting a Cap With a Tax
Since the introduction of the luxury tax, the NBA has seen a continued decline in salary cap exceptions and luxury tax offenders, as well as the extent to which the salary cap is exceeded.

This suggests success, but compliance is only part of the story. To assess the full impact of the tax, one needs to look at three other areas: (1) how it affected/restrained overall spend; (2) whether it decreased economic inequality across teams; and (3) whether it improved competitive balance.
1) Restraining Spend
In recent years, there’s been a significant tightening in the distribution of payrolls across teams. Throughout the 1990s and 2000s large market teams would frequently spend 1.5-2.0x the median payroll in order to improve their shot at a championship. The Bulls’ 1997 and 1998 championship winning rosters – which featured Michael Jordan, Scottie Pippen and Dennis Rodman – hit a still-record 2.25x and 2.15x respectively. This was great for many fans, but its fairness is debatable.
Since 2009, however, only one team has crossed the 1.5x mark: the 2013-14 Brooklyn Nets. And notably, this ended rather disastrously for the team, as it had intended a “roster rebuild” while spending nearly 50% of the salary cap on aging veterans Paul Pierce and Kevin Garnett alone. Today, the standard deviation in team salaries is lower and more stable than at any time in the salary cap’s history.

Like most regulations, however, the luxury tax also created a new dynamic for market participants to exploit. Not only must GMs now contend with luxury tax game theory against both competitors and the league front office, many superstars (e.g. Anthony Davis and LeBron James) are basing their contract negotiations on expected changes to the caps and taxes. As a result, we’ve seen concerted efforts to co-ordinate player contract expirations around CBA expirations. This undermines both roster stability and fans’ ability to invest in their teams, and forces GMs to further lever payrolls if they want to keep top talent. There’s nothing wrong with this per se, but it raises the question of whether the LT is working as intended. And given the average luxury tax payment has doubled since the introduction of escalating fines and the repeater tax, it’s hard to argue it has been able to stop truly extravagant spenders. To them, it seems to be more nuisance than deterrent.
2) Redistributing Wealth
Although the precise allocation is hard to estimate as an outside observer, it’s believed that luxury tax receipts have historically been split 50/50 between broadly defined league costs and redistributions to non-taxpaying teams. On that basis, untaxed teams would have received roughly $7.3M each during the first year of the tax. Given these teams averaged only $30M in attendance and concession revenues that year, many argued that this sum more than covered any financial or competitive disadvantages incurred as a result of the luxury tax’s existence. By 2014-15, however, this sum had shrunk to $1.8M thanks to a reduction in offenders, which reduced total receipts and increased the number of teams sharing the proceeds. Though the introduction of more punitive tax rules led to an increase in LT distributions in three of the most recent four seasons, the ultimate per-team distributions increased non-LT team revenues by an average of only 2-5%.

Furthermore, the 50% of luxury tax revenues retained for “league purposes” are typically used to fund the league’s own revenue sharing program, through which the income of the league’s most profitable teams are redistributed to its least. As a result, LT payments (primarily made by the most profitable and largest market teams) partially offset the profit payments these same teams already needed to make (i.e. the top 10 teams would collectively contribute $50M of their profits to the bottom 10, but the luxury tax has already contributed $30M, so they only give up another $20M). What’s more, paying the luxury tax reduces a team’s operating income, and therefore the amount of profit that team would have to share in the first place. Accordingly, not all luxury tax fines should be viewed as incremental spend for top teams – it’s the same spend with a different name and a more self-centered outcome.
3) Driving Competitive Equality
Prior to the tax’s introduction, the correlation between payroll and performance had been increasing steadily. In the years immediately following the tax’s introduction, this correlation plummeted – in fact, two of the following three seasons included record lows for the NBA. But starting in the 2005-06 season, the correlation slowly ticked back up to pre-tax levels, only to drop back down once again after the NBA introduced more severe tax rates. In retrospect, this shouldn’t surprise; teams likely needed a few seasons to work through the changes to the system to ensure that each dollar spent was bringing in the maximum amount of player (and thus team) value. As such, the tax’s present-day success may too be short-lived.

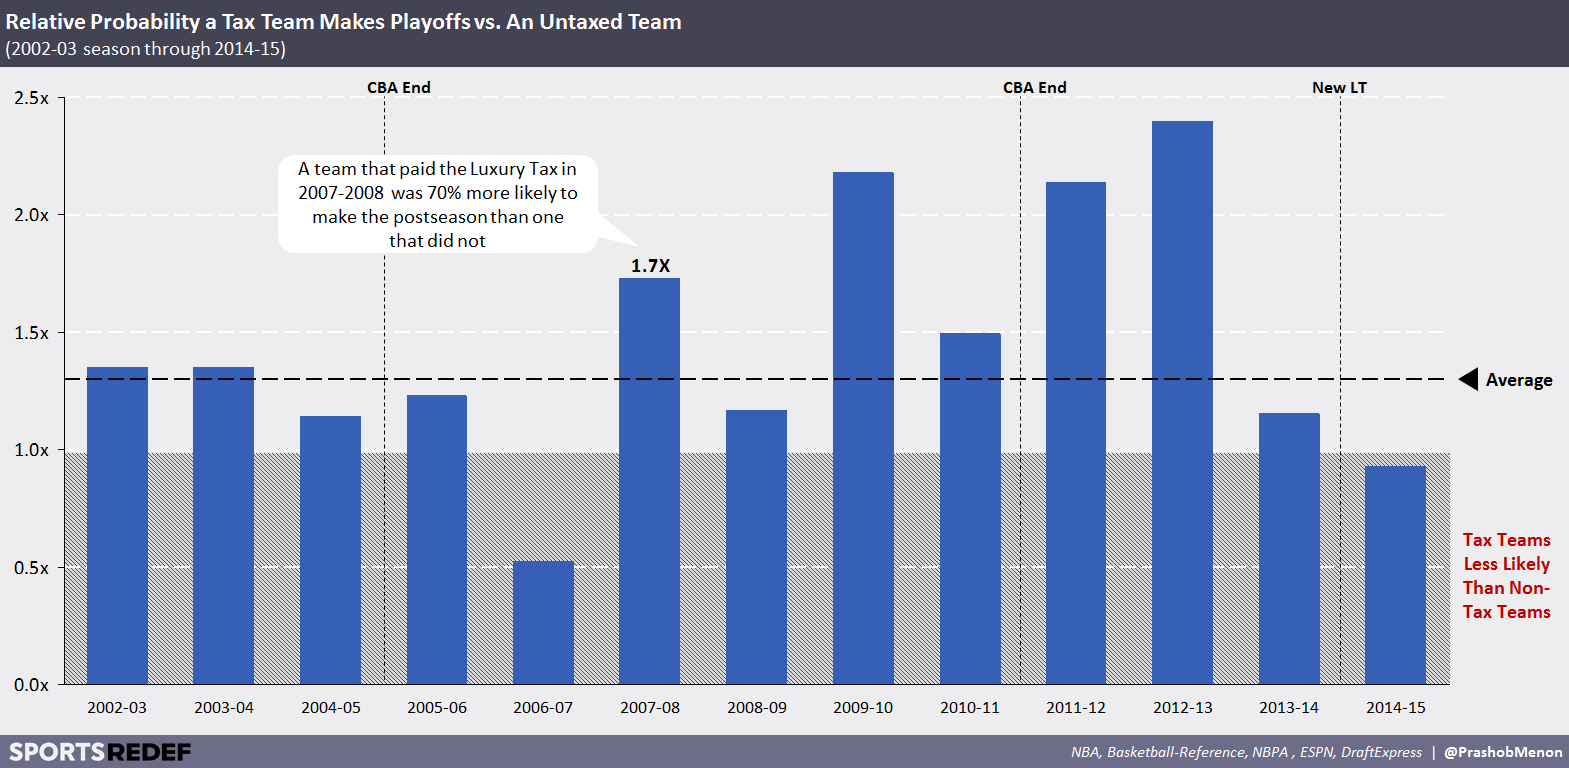
Even if the correlation between dollars spent and the number of regular season wins doesn’t rebound, the NBA has returned to a dynamic where the top spenders routinely dominate playoff berths and bottom spenders rarely qualify. Accordingly, luxury tax teams are 1.3x as likely to make the playoffs as teams that don’t pay the tax (63% v. 49%) – an advantage that has largely held since the tax’s inception and across the Eastern and Western conferences. Only twice since 2002 have tax teams been less likely to make the post-season than non-tax teams.
This history suggests that title-seeking GMs shouldn’t hesitate to “overspend,” especially for top players. However, there appears to be little relationship between the amount of tax paid and the likelihood of making the post-season:
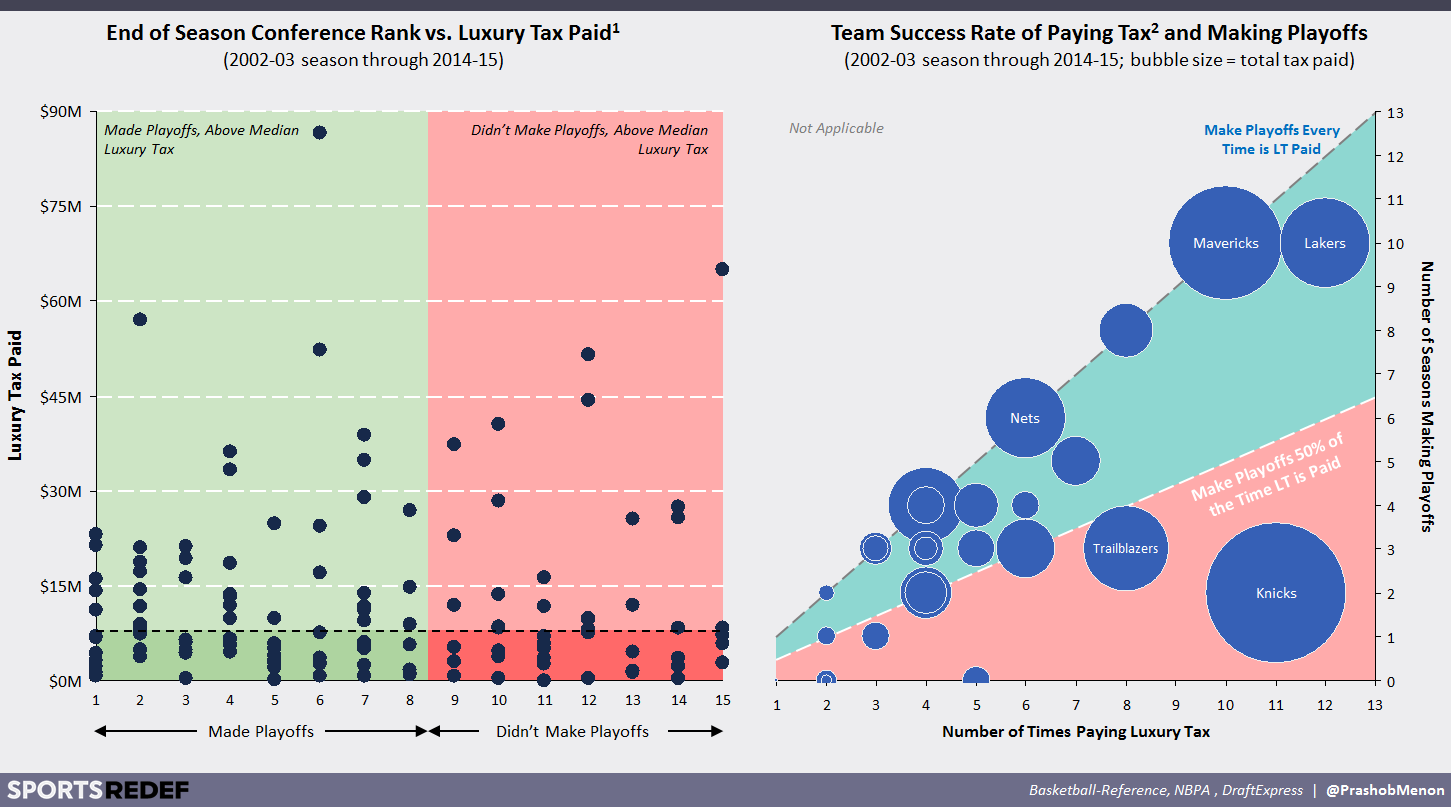
This is where traditionalists would point out that a GM’s job is to use intuition and experience to put together the right team for the job. But it’s not simply a matter of paying to win:
- The Spurs have paid the tax thrice since the introduction of the luxury tax in 2002-03, making the playoffs each time. However, none of their four championships have coincided with a taxpaying season[2]
- The Warriors, who beat the Cavaliers in the 2015 finals, have never paid the tax (though Draymond Green’s 2015-16 through 2020-21 contract will push them over the edge in at least the 2015-2016 season)
- The Mavericks have paid the tax in 10 of the luxury tax’s 13 seasons and made the playoffs each time (winning the championship once)
- The Knicks have paid the tax in 11 of the luxury tax’s 13 seasons, but made the playoffs only twice. And when they incur the tax, they spend big – paying 2-3x as much as the average luxury tax offender. Cumulatively, the Knicks have paid roughly 50% more in total tax than the Mavs, the next highest team. Between 2005 and 2007 alone the team paid Allan Houston, Penny Hardaway, and Stephon Marbury a combined $100M despite avoiding the playoffs in each season.
A willingness to incur the tax directly corresponds with playoff appearances, but that isn’t a shock. A team should incur the tax only if there are players worth incurring it for – players who will help a team win. However, the amount of luxury tax paid in a specific season doesn’t correlate with the number of regular season games won or how far a team progresses through the playoffs. This leads to three interconnected observations. First, the tax is most effective when it’s used to retain only a single critical player or two; second, incurring significant fines to “stack” an entire team is unlikely to deliver the intended result (competitive dominance); and three, GMs looking to initiate a roster “rebuild” should not view the luxury tax as a way to keep and build around their top players. Instead, they need to reassess their bench more holistically. This is particularly clear when looking at prior season performance:

Teams that pay the luxury tax following a playoff season are more likely to make the playoffs again even if they didn’t incur the tax in the prior year. And teams that continue to pay the tax despite failing to make the playoffs (i.e. opted to retain most of their roster season-over-season) actually underperform those who don’t.
But simply making the playoffs isn’t enough (unless you’re from my hometown of Toronto). Post-season depth matters, too.

Not only are tax paying teams 30% more likely to make the playoffs, they continue to outperform non-tax teams throughout the playoffs (note that the diminishing size of the sample as one progresses reduces the reliability of these figures). Though the spread here might seem slight, a 3 – 6% difference is profoundly important in professional sports regardless of whether you’re a fan, player, coach or gambler:

Cause versus correlation is difficult to separate in professional sports but, in general, GMs who pay the luxury tax win more often than GMs who don’t. As a result, a team’s willingness to shell out can be the deciding factor between disappointment and triumph. And clearly, deep pocketed owners have taken notice.
To Coerce, A Tax Needs to be Punitive
In aggregate, the soft cap + luxury tax model shows mixed results. Compliance is typically short-lived, and despite some sustained improvements (such as the distribution of team payrolls), the NBA continues to see distortions in player contracts and playoff qualifications. This suggests two possible conclusions. First, it may be impossible to identify the right payroll framework and get the NBPA and NBA to agree to that same model. And even if this did happen, there are numerous exogenous changes and inputs (e.g. macro-economic conditions, bidding wars for NBA TV rights, new ultra-wealthy owners, etc.) that quickly alter the very dynamics the luxury tax was designed to control. The fact that the NBA’s salary cap system has been so frequently tweaked suggests this hypothesis is at least partly true.
Second, the luxury tax itself may not be sufficiently punitive. This could mean either the fine itself is too low, or that the ultimate cost of the tax may be less that the “billed rate” of the fine. In theory, stronger regular and post-season performance should increase a team’s revenues, for example, as could the presence of a superstar player. As such, it’s important to investigate a team’s seven major sources of revenue, each of which has three key considerations, to determine how they might be positively affected by luxury-tax powered rosters.

The first consideration is whether the performance of an individual team would materially impact a given lever. Playoff bonuses, for example, are paid only if a team makes the post-season and are sized based on how far they progress. On the other hand, the value of national TV rights (which are sold years in advance) is independent of an individual team’s performance in a given year.
The second qualifier is whether incremental revenues are distributed to specific teams or evenly split across the league (per the revenue sharing agreement). Incremental attendance revenues from playoff home games, for example, are largely retained by the home team. Though league-wide merchandise revenues may be incrementally affected by which teams excel in the post-season (LeBron James’ team going to the finals will likely increases jersey sales), the total value is pooled and distributed evenly across all teams.
Finally, there’s whether these funds are received in-year (i.e. playoff bonuses) versus in the following year (a strong regular or post-season performance should raise attendance and/or prices in the following year).
This leaves five variables to investigate (#1, #2, #3, #4, and #5). However, given the length of regional sports contracts (typically 5+ years) and most sponsorship agreements, the luxury tax hasn’t been in play long enough to perform rigorous analysis (you can find some interesting commentary on RSN contracts here). As such, one should focus primarily on numbers one through three.
Revenue Levers #1 & #2: Playoff Bonuses & Playoff Attendance
Teams that make the playoffs receive bonuses from the NBA and generate incremental attendance/concession revenue from home games (on average, the latter represents 90% of total playoff revenues). About 34% percent of tax paying teams don’t make the playoffs, so only two in three tax teams have the chance to generate incremental playoff revenues. And given the reliance on attendance-based revenues, revenue upside varies tremendously based on the extent to which a team progresses through the postseason:
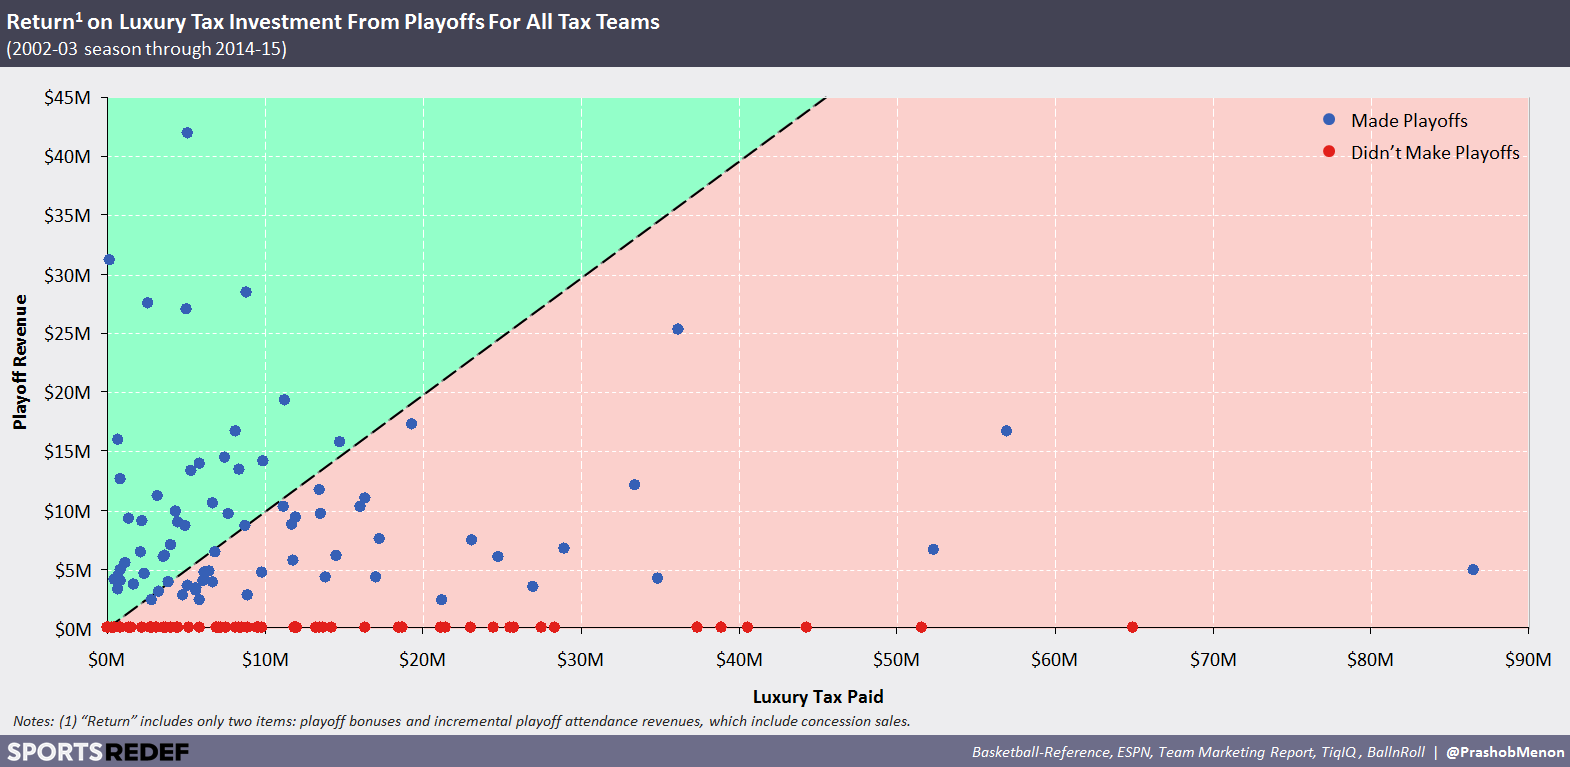
On average, 50% of playoff-making tax teams earn enough playoff revenue to at least offset the tax. However, there are two critical caveats here. First, the vast majority (61%) of these teams paid less than $10M in luxury tax fines. Second, and more important, the total amount of playoff revenue overstates the return. Many of these teams, after all, would still have made and progressed through the playoffs even if they had lost the player they kept only by exceeding the luxury tax threshold. What matters is not total playoff revenues, then, but the incremental playoff revenue that can be attributed to the luxury tax’s impact on playoff appearance and depth (both of which are statistically correlated to paying the LT). When focusing on just the expected incremental value, no teams actually generate profit above the tax paid. Keep this concept in mind; it will be important later.
Revenue Lever #3: Regular Season Attendance & Concession
Considering the effects of luxury tax spending beyond the year incurred is critical for two reasons. First, players aren’t signed for one-year deals very often (though LeBron may change this). As such, paying a tax in one year can easily result in taxation during subsequent seasons – and in fact, the average luxury tax paying team paid the tax in seven of 13 seasons to date. This follow-on implication is particularly important since the introduction of the repeater tax, which makes successive luxury tax seasons even more expensive. Second, the luxury tax’s impact on a team’s regular and postseason performance (not to mention its role in attracting superstar talent) should lead to improvements in tickets sold and ticket prices the following year. When we consider these metrics in comparison to untaxed teams, we see the following:
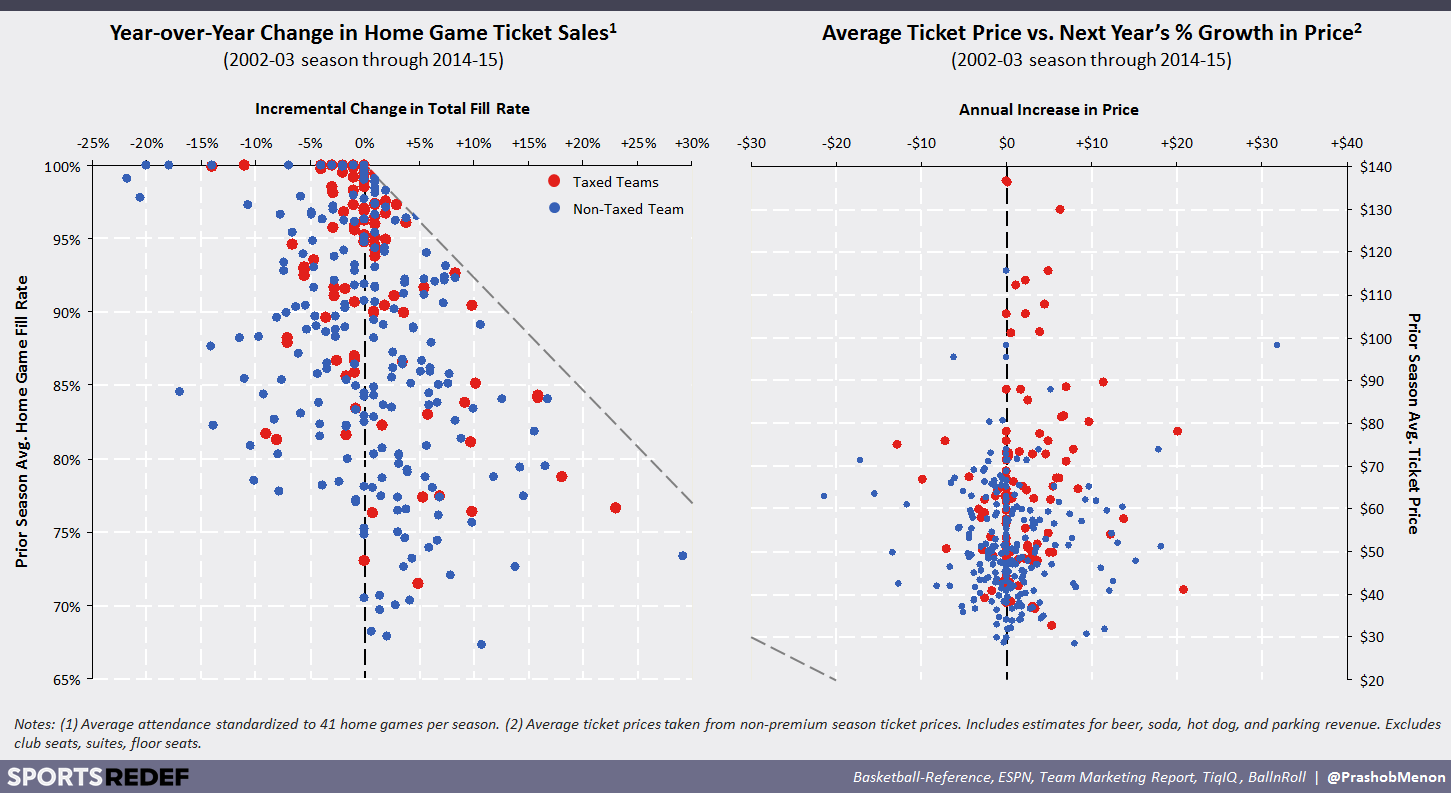
If we translate these results into bands and exclude those with only a few data points (i.e. there have been 185 instances of a team having an average season ticket price of $40-60 over the past 13 seasons, but only four of $120-140), we generate the following summary table:

In general, tax teams are no more likely to see year-over-year attendance improvements than untaxed teams, though their gains do tend to be larger. Things are a little better on the pricing side. Tax teams are more likely to increase average ticket prices year-over-year and see 2-3% larger improvements.
These differences are meaningful to be sure – but financially, they’re far less significant. A 2% increase in attendance and ticket prices will increase the average team’s attendance and concession revenue from $45.6M to $47.5M – far from enough to finance tax payments. Even the highest revenue team, the Knicks, which had about $111M in attendance and concessions revenue during the 2014-15 season, would see only $4.4M in lift. Some owners argue that the benefits of paying the luxury tax play out over several seasons, not just two (e.g. a team pays a one-time tax in order to kick-start a multi-year roster rebuild). However, the fact that the vast majority of taxed teams continue to pay the tax in several subsequent seasons suggests that the fine is seen more as ongoing fuel than a temporary boost. Furthermore, the aforementioned averages would include any compounded gains achieved through the multiple tax-paying seasons (i.e. a 10% increase in ticket prices for three consecutive years results in a total increase of 33%, not 30%). Regardless, the gains in pricing and attendance are so modest that even if they persisted several years after a one-time tax, a team would be hard pressed to offset any initial tax investment.
The Full Revenue Picture
On the surface, a profit-maximizing owner has good reason to exceed the luxury threshold. In doing so, they not only increase their team’s chance of making and progressing through the playoffs (thereby resulting in incremental playoff revenue), they’re also more likely to see increased ticket sales and prices the following year. Yet when we focus on the luxury tax’s incremental effect on these levers as compared to non-taxed teams, the return profile looks dramatically different:
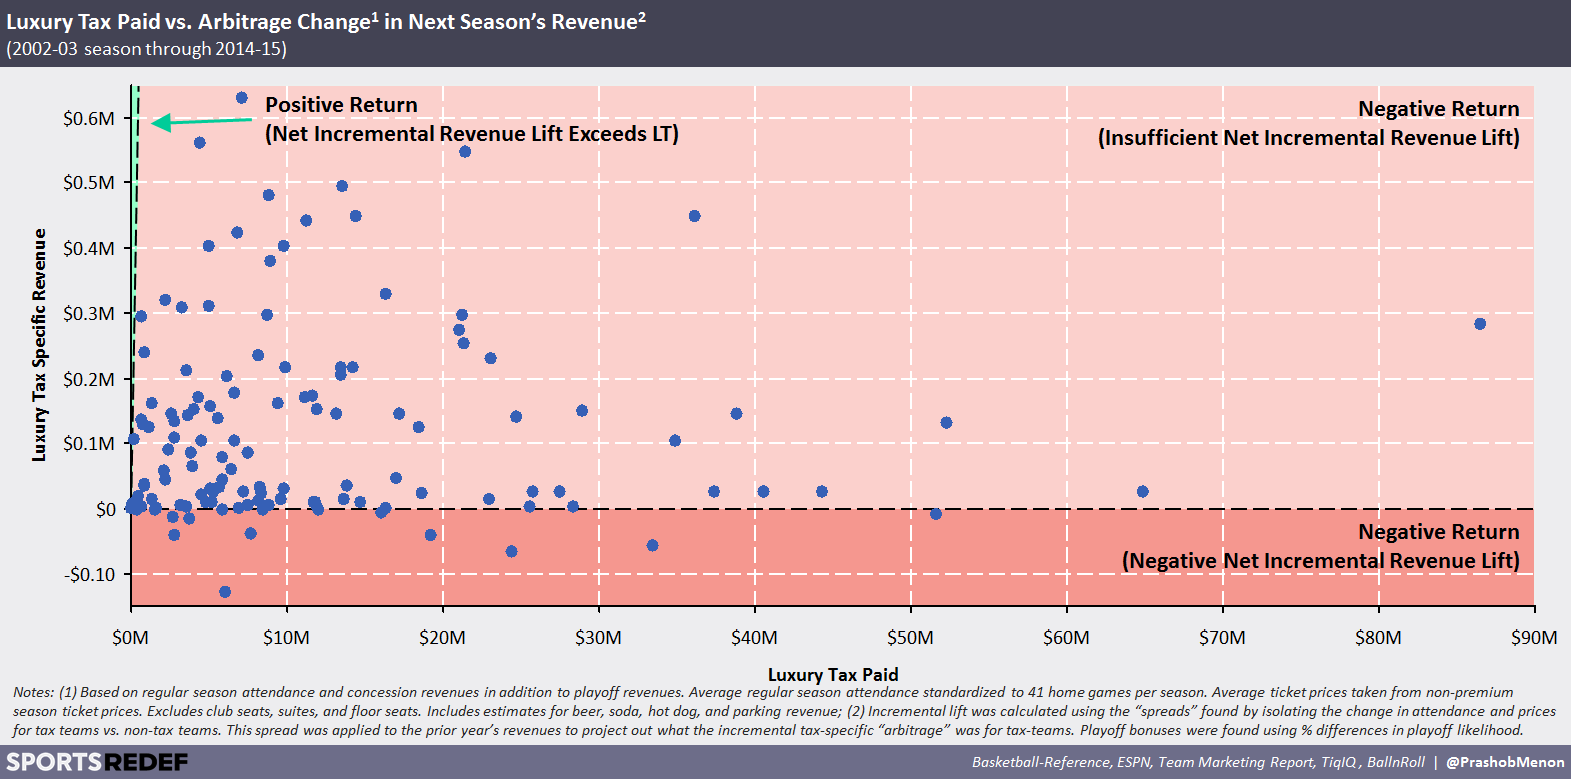
Ultimately, we can’t know the exact impact of the luxury tax on a team’s performance or economics because we can’t know how an individual team would have performed without an individual player. But on a statistical basis, it’s extremely unlikely that paying the luxury tax would achieve in a positive return on investment. And even if you assume the uninvestigated levers (such as RSN deals or sponsorships) are impacted by a team’s tax-driven performance, their incremental lifts would have to be immense to even bring the ROI on the tax to 0%.
This suggests that a luxury tax payment is, in fact, roughly equivalent to its net cost – which should be a positive conclusion for the league front office. But it’s not. The fact that teams don’t shy away from $10-20M LT losses – despite the salary cap averaging only $53M since the tax’s introduction – shows that that the current fines simply aren’t enough. They may appear significant, but the behavior of those who actual pay it suggests otherwise.
SO WHAT’S A LEAGUE TO DO?
Regardless of the sport or the degree to which one is a fan, it’s almost assured that athlete compensation is a subject of either amazement or frustration. Payrolls, after all, determine which teams have a shot, which fans get to claim a superstar, and which players become multimillionaires several times over. More controversially, payrolls also provide insight into an owners’ relative prioritization of profits v. titles. The introduction of the NBA’s salary cap in 1984 affected each of these areas, but its goal was to benefit every stakeholder overall. And after 13 seasons under the cap, it’s fair to review the model to see if it actually did.
Performance:
- Teams that paid the tax were 30% more likely to make the playoff than teams that didn’t (63% v. 49%)
- In addition, tax teams were more likely to win each playoff round (3-6% more likely per round pre-finals)
- However, how much the teams paid in tax had no significant effect on these outcomes
- If a team paid the tax in one season, failed to make the playoffs, and then paid again the following year, they were actually less likely to reach the playoffs than if they just dropped the tax and changed their roster (32% v. 48%)
- This suggests that when GMs have a team that works, it’s likely worth paying the tax to keep key players. If they don’t, they’re better off shaking up their roster (one that would also be cheaper given the salary cap can only be exceeded by retaining players)
Financials:
- No teams have been able to recoup their investment in the tax after isolating for tax-specific incremental revenue (across playoff revenues + the following season’s attendance and concession revenues), meaning the more spent in tax the greater the investment loss
- In general, it appears that any fine under $10M and potentially up to $20M is unlikely to dissuade a motivated owner from exceeding the LT threshold. Under the current model, this would allow for $6.5M to $11.5M in payroll above the 2015-16 season’s $85M threshold (without a repeater surcharge), worth a total of $21M to $26M above the soft cap ($70M)
By and large, the luxury tax appears to be exactly as the name implies: progressive taxation. The (seemingly) wealthiest teams spend excessive amounts on their rosters and the resulting taxes benefit the league. Still, there is a clear benefit to teams that pay the tax: improved regular and post-season performance.
While the prospect of paying a few million in taxes might seem digestible for any professional team, it’s important to remember that that’s in addition to the tens of millions already spent in exceeding the salary cap and luxury threshold. For lower revenue teams, this is particularly challenging, as their comparatively modest ticket prices and audience sizes mean they require significantly greater tax-driven increases to recoup their investment. As a result, the luxury tax is ultimately regressive. It disadvantages smaller teams either financially (should they want to compete for top players) or performance-wise (due to the playoff performance gap). And accordingly, the NBA finds itself back to the very situation it faced before the introduction of the salary cap in 1984, the luxury tax in 2002, and at the time of each successive change to the luxury tax: diminishing competitive equilibrium.
This calls into question why there’s a luxury tax in the first place. The economics of high payrolls are already prohibitive for lower revenue teams and the tax only exacerbates this. Meanwhile, the fact that higher revenue teams continue to spend – despite no economic benefit – shows the tax is a nuisance, not an impediment. The Brooklyn Nets, for example, spent a reported $100M on payroll during the 2013-14 season – far in excess of both the salary cap ($59M) and tax threshold ($70M) – even though the move resulted in a nearly $86M tax bill (netting out to $186M in total spend, or 3.2x the cap).
One of the key flaws under the luxury tax model is the extent to which franchise equity has skyrocketed since its introduction. Over the past 14 years, the value of the average team has grown an astonishing 8.3% per year (or roughly threefold overall), with median annual gains of nearly $43M. Teams based in the top three TV markets (New York, Los Angeles and Chicago) grew even faster: 11.7% (or $114M) per year:

For the luxury tax to be effective, team owners must truly feel the cost of every salary dollar spent above the threshold. Faced with such significant and persistent annual gains in equity value, the owners of many major teams likely view the luxury tax as an inevitable cost of doing business, or simply the investment required to win a title. Rationally, of course, a dollar spent is a dollar spent – but to owners, each year has been more valuable than the last, which means the net effect of the tax may go unfelt. Again, the Brooklyn Nets are a perfect example. One year after the Nets’ billionaire owner, Mikhail Prokhorov, incurred the $86M luxury tax fine (which helped drive operating income down from -$19M to -$99M year-over-year) Forbes doubled its estimate of the team’s value to $1.5B, and Prokhorov put the team up for sale for a similar amount (the precise price is unknown given the team is bundled with other assets, including the Barclays Center). This doesn’t mean that the luxury tax is without its short-term cash consequences – it’s still a significant cash outlay. However, owners not interested in selling their teams can easily cover the tax through the use of league credit facilities or taking a loan secured against the equity value of their team (which probably added 2-4x more value in a given year than a likely tax payment would cost).
That being said, the soft cap was never an ideal outcome. Owners wanted a hard cap while players wanted none at all. The soft cap was intended as a middle ground that aided all parties: teams with the best players could worry less about being forced to trade them; players could command higher salaries; and fans could invest in top players without worrying they would all leave town. Today, however, it’s time to rethink the NBA’s salary model, which is unique among the major North American leagues. The soft cap doesn’t need to be abolished, but at minimum, the luxury threshold should be replaced with a firm ceiling. The tax itself simply isn’t effective, even at its escalated rates.
Proponents of the existing model will argue that after only 13 seasons, the tax remains too unstudied. Yet, the NBA’s original soft cap was in place for only 19 seasons before the luxury tax was introduced to correct its failings. Furthermore, the NHL, NFL, and MLB all have their own salary models, providing sufficient comparative evidence around these alternative models.
As the NBA and NBPA head towards the December 2016 deadline to opt out the 2011 CBA, we’re likely to hear countless complaints about the ways in which today’s system does and does not control (or free) team payrolls, ensure (or erode) competitive balance, and improve (or worsen) economic inequality across teams. Optimizing across each of these areas is incredibly tough. But today’s byzantine cap model, which includes two thresholds, countless exceptions, variable fines, vague uses of tax revenue and a history of initial but ultimately short-lived effectiveness, is not the answer. The NBA once led the world of professional sports with its forward thinking salary model. It’s time to retake this position by replacing the luxury tax threshold with a hard ceiling – if not replacing the soft cap itself with a hard one.
Prashob Menon is a Strategy Consultant in the Technology, Media & Telecommunications sector. All views are his own. He can be reached at menon.prashob@gmail.com or followed on Twitter.
Post-Script: 2015-16 Season
The NBA season kicked off on October 28th, 2015, and based on the salaries available, seven teams will incur the tax in the 2015-16 season, up from five the previous season. Total tax collected will jump about 28% thanks largely to the Cavaliers but the average amount paid per team will drop about 27%:

NOTES:
[1] The tax was actually negotiated to start during the 2001-02 season but BRI targets weren’t met, making the 2002-03 season the first with a tax. During the 2004-05 season the NBA didn’t collect a luxury tax because BRI targets weren’t hit. However, the status of the tax is only announced towards the end of the season, meaning GMs made personnel decisions in anticipation of a tax being collected. For that reason it’s fair to include an estimate of the tax for the 2004-05 season for the purposes of this analysis.
[2] I’ve seen sources put this number at five. The two occasions in contention are <200K, making them too small to affect the analysis in question. This is true more broadly for the analysis as a whole. Since teams don’t post official salaries I only have external sources to use. To account for this uncertainty I checked each team’s salary against numerous sources and against the tax payer list included here. There were minor discrepancies but by using the same source the trends being identified are still valid.